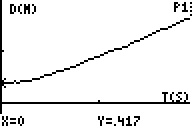
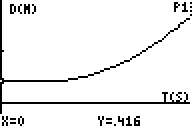
Graph 1 Graph 2
Name ____________________
Look at the following two distance time graphs of a falling coffee filter and a falling book.


Graph 1
Graph 2
1.) Which graph is of a falling coffee filter? Why?
b.) Which is of the falling book? Why?
2.) What was the starting distance of the filter ____________ of the book _________________
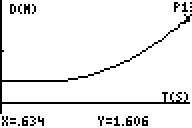
Here are the same graphs only this time they show the end time of the fall.
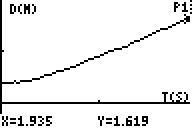
Graph 3
Graph 4
3.) What was the ending distance of the filter _________________ of the book _____________?
4.) What was the falling TIME for the filter______________ of the book ________________?
5.) What was the average velocity of the filter _____________ of the book ______________?
6.) Compare their average velocities. Why are they the same or why are they different?
Here are the velocity time graphs for the coffee filter and the book
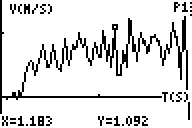
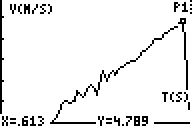
Graph 5 Graph 6
7.) Which is the V vs. T graph of the coffee filter ___________ and the book ______________.
b. Explain how you know the difference between the two
8.) What was the maximum velocity of the coffee filter_____________ the book ______
Look at the following screen shots for a V vs. T graph of a falling object. Calculate the slope of the line using the points provided (velocity is in meters/sec and time is in seconds)
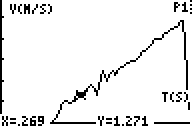
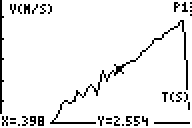
9.) What is the slope of the line? ( show work)
10.) What is the know acceleration of gravity?
11.) Are these two numbers close? Explain why or why not